-
 Dextrose
-
 Kepler's second law
-
 Homeosis
-
 Phoenix Mars Lander
-
 Declination
-
 Surge
Surge
-
 Phytosociology
-
 DSA
DSA
-
 Hormone therapy
-
 Emulsion
-
 Limbic system
-
 Concrete
-
 XMM-Newton satellite
-
 Venus
Venus
-
 Pelagic life forms
-
 Stamen
-
 Xbox Live
-
 CERN
CERN
-
 XviD
XviD
-
 Mortar
-
 Transit
-
 Moraine
-
 Tabular facies
-
 Hysterography
-
 Roaming
-
 Die
Die
-
 Coordinate system
-
 Premammalian
-
 Lagging
-
 Neutral current
Phase diagram
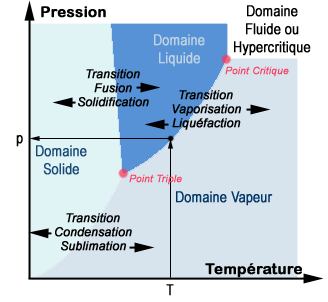
In thermodynamics, a phase diagram is a graphic representation in two and sometimes three dimensions of the various phases of a substance such as water, an alloy etc.
Usually the thermodynamic temperature and pressure variables are used. In the diagram below each point corresponds to a pair of temperature and pressure conditions. According to these conditions a pure substance will exist in the various liquid, solid etc. phases. Transformations from one phase to another are given precise names. Thus sublimation is the name given for when a solid passes directly to the gaseous state. The term phase transitions is used.

Phase diagram for a pure substance (Credit: University of Scherbrooke).
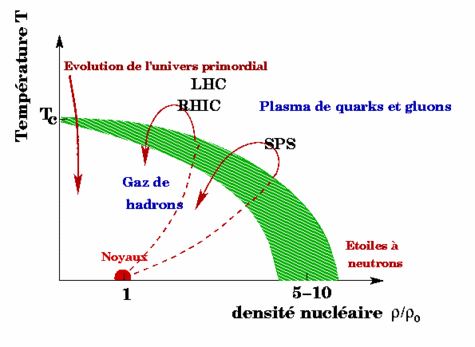
There are phase diagrams in geology and astrophysics for example. Thus, in precise temperature and density conditions, hadrons become unconfined and form a quark and gluon plasma called a Quark Gluon Plasma or QGP.
This is shown in the diagram below.

QGP phase diagram (Credit: in2p3).
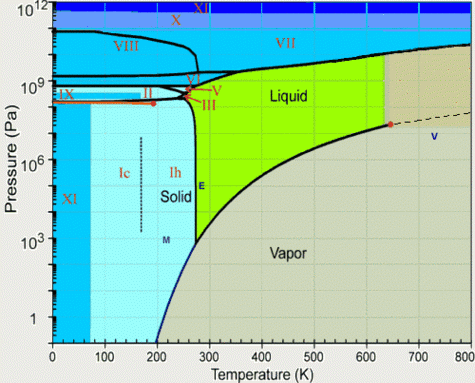
 Water phase diagram; for a given temperature and pressure couple in the diagram above the water will be a liquid, a gas or in one of its many ice states.
Latest
Fill out my online form.


